Vital Signs
What are Vital Signs?
Vital Signs are measurements that your doctor takes every time they see you.
What are Vital Signs in Wingspan Health?
The Vital Signs page in your Wingspan Health account allows you to see your vitals in a way you can actually understand with data displays and graphs. By hovering over anything you see on the page, we'll explain what you're looking at when you're looking at it. You can see if trends match up to what was going on before and in the present!
In Wingspan Health, we break them down into four categories:
You can also see them all in the order they happened under All Vital Signs.
Example GIF of someone's vital signs for blood pressure over time.
How can you see trends over time with your vital signs in Wingspan Health?
After you connect your health accounts to your Wingspan account, you can see your healthcare data of your vital signs in data displays and graphs.
To see them, click on Vital Signs in the menu on the left side of your screen and there you can select one of five categories to view your data:
Read more below for overviews on each category in the Vital Signs section of your Wingspan account.
GIF showing how to access the Vital Signs pages from the dashboard of a Wingspan Health account.
Body Size
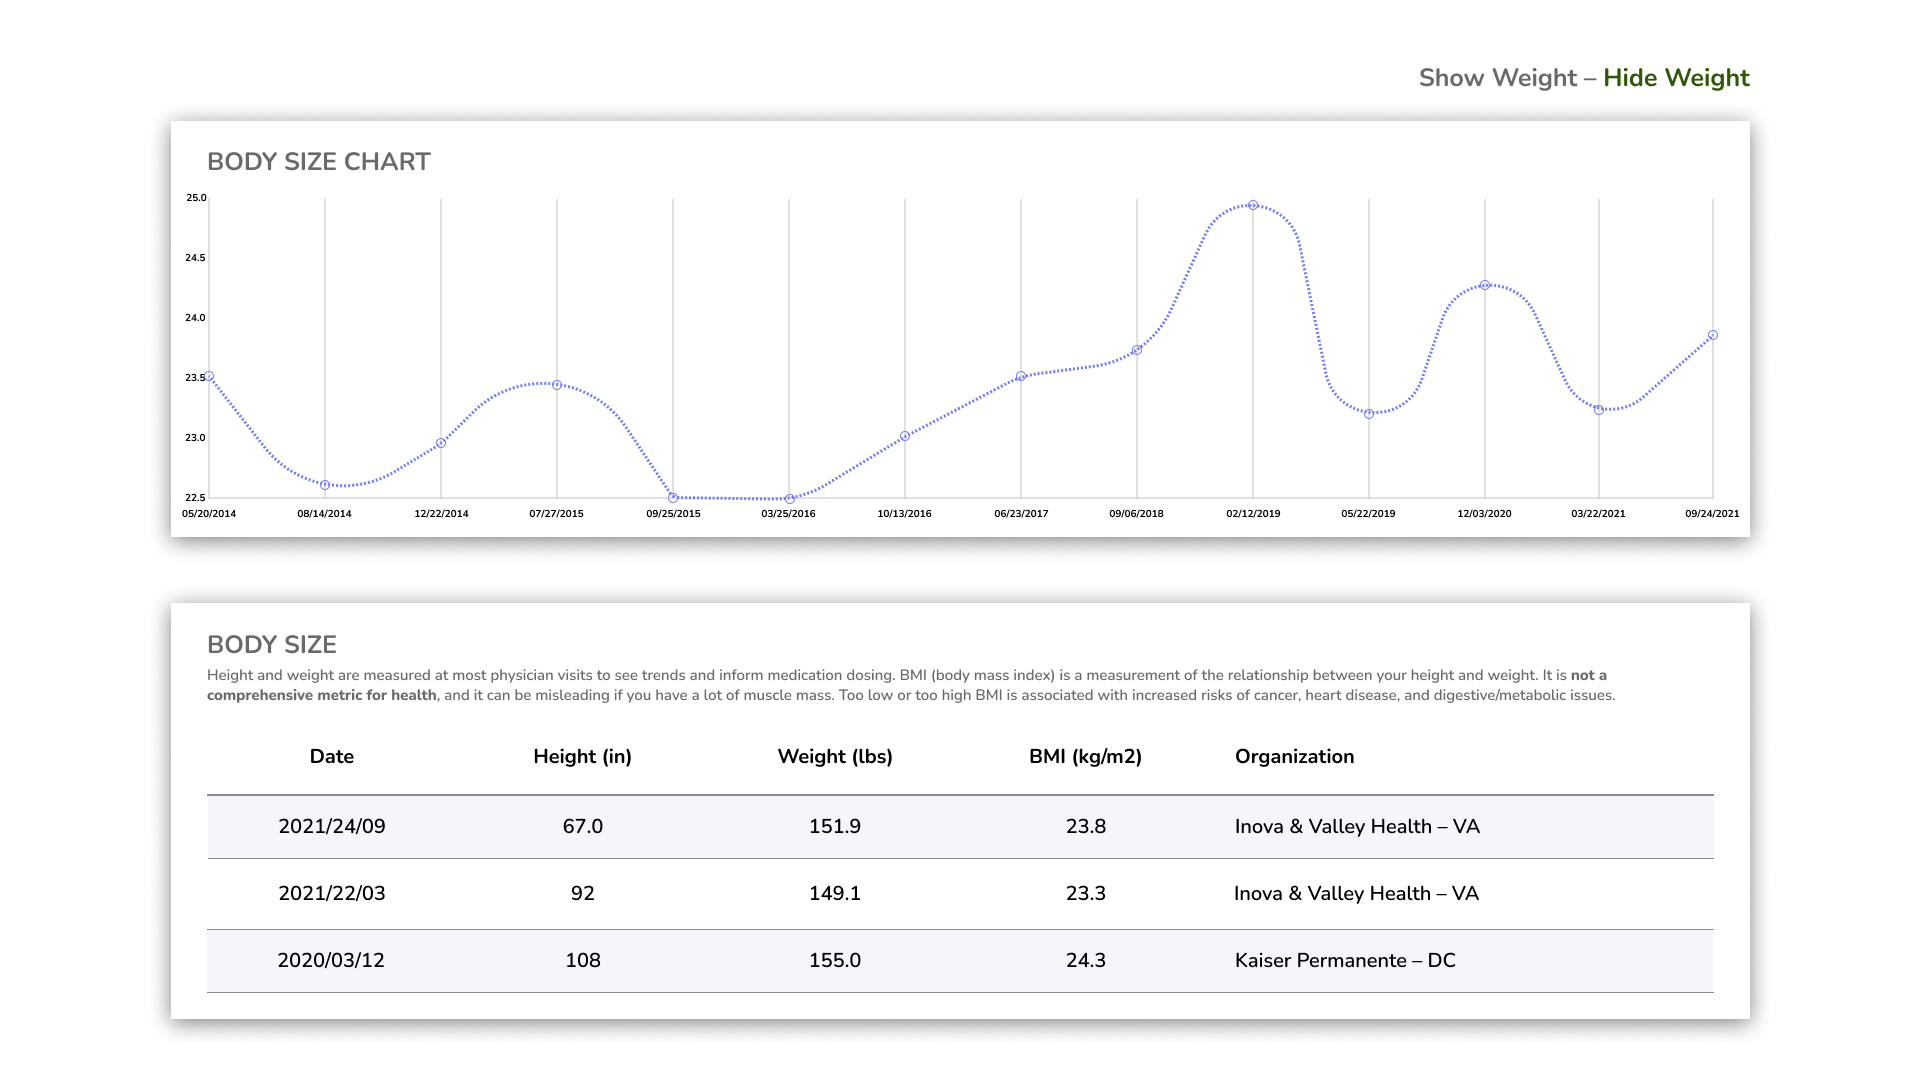
Body Size is a measure of your height and weight. Your height and weight are measured at most physician visits to see trends and inform medication dosing.
The Body Size Chart shows your BMI over time in a line graph. BMI (body mass index) is a measurement of the relationship between your height and weight. It is not a comprehensive metric for health, and it can be misleading if you have a lot of muscle mass. Too low or too high BMI is often associated with increased risks of cancer, heart disease, and digestive/metabolic issues.
The Body Size Data Display shows a historical list of your Height (measured in inches), Weight (measured in pounds), and BMI (calculated from height and weight).
How to Hide Weight / Show Weight
You can toggle between showing your weight or not by clicking on Hide Weight and Show Weight on the top right in green bolded text.
Clicking Hide Weight will only show the Body Size Data Display with the Height measurement and exclude Weight and BMI.
Clicking Show Weight will have both the Body Size Chart and Body Size Data Display and include Weight and BMI.
Blood Pressure
Blood Pressure is a combined measure of how much pressure your blood exerts on your artery walls.
There are two numbers that make up blood pressure: Systolic and Diastolic. The Common Format is how blood pressure is read and interpreted consisting of both measurements, e.g. "120 over 80."
The Blood Pressure Chart shows your Systolic and Diastolic blood pressure over time in a dual-line graph.
The Blood Pressure Data Display shows a historical list of your blood pressure formatted with Systolic, Diastolic, and Common Format.
Hovering over the measurements will give you some context of what’s normal for Systolic and Diastolic blood pressure.
Systolic is the pressure your blood exerts on your arteries when your heart beats.
Normal: 90-120
Elevated: 121-129
High: 130-139
Very High: 140+
Diastolic is the pressure your blood exerts on your arteries when your heart rests between beats.
Normal: 60-80
High: 81-89
Very High: 90+
While high blood pressure is common, it is often associated with heart disease. On the other hand, low blood pressure is less common, and often associated with dehydration, nutrient deficiency, or heart problems.
Visual displaying a blood pressure chart and data display over time in Wingspan Health.
Heart & Lung
Heart rate, breathing rate, and oxygen saturation combine to give you and your doctor an idea of how your heart and lungs are functioning. Low heart and respiratory rates are common indicators of fitness, however, if these numbers are low and you are not physically fit, consider discussing with your physician.
Heart Rate Chart
The Heart Rate Chart shows your heart rate over time in a line graph.
Low: <60 per minute
Normal: 61-79 per minute
Elevated: 80-99 per minute
High: >100 per minute
Respiratory Rate Chart
The Respiratory Rate Chart shows your respiratory rate over time in a line graph.
Low: <12 per minute
Normal: 12-19 per minute
Elevated: 20-25 per minute
High: >25 per minute
Oxygen Saturation Chart
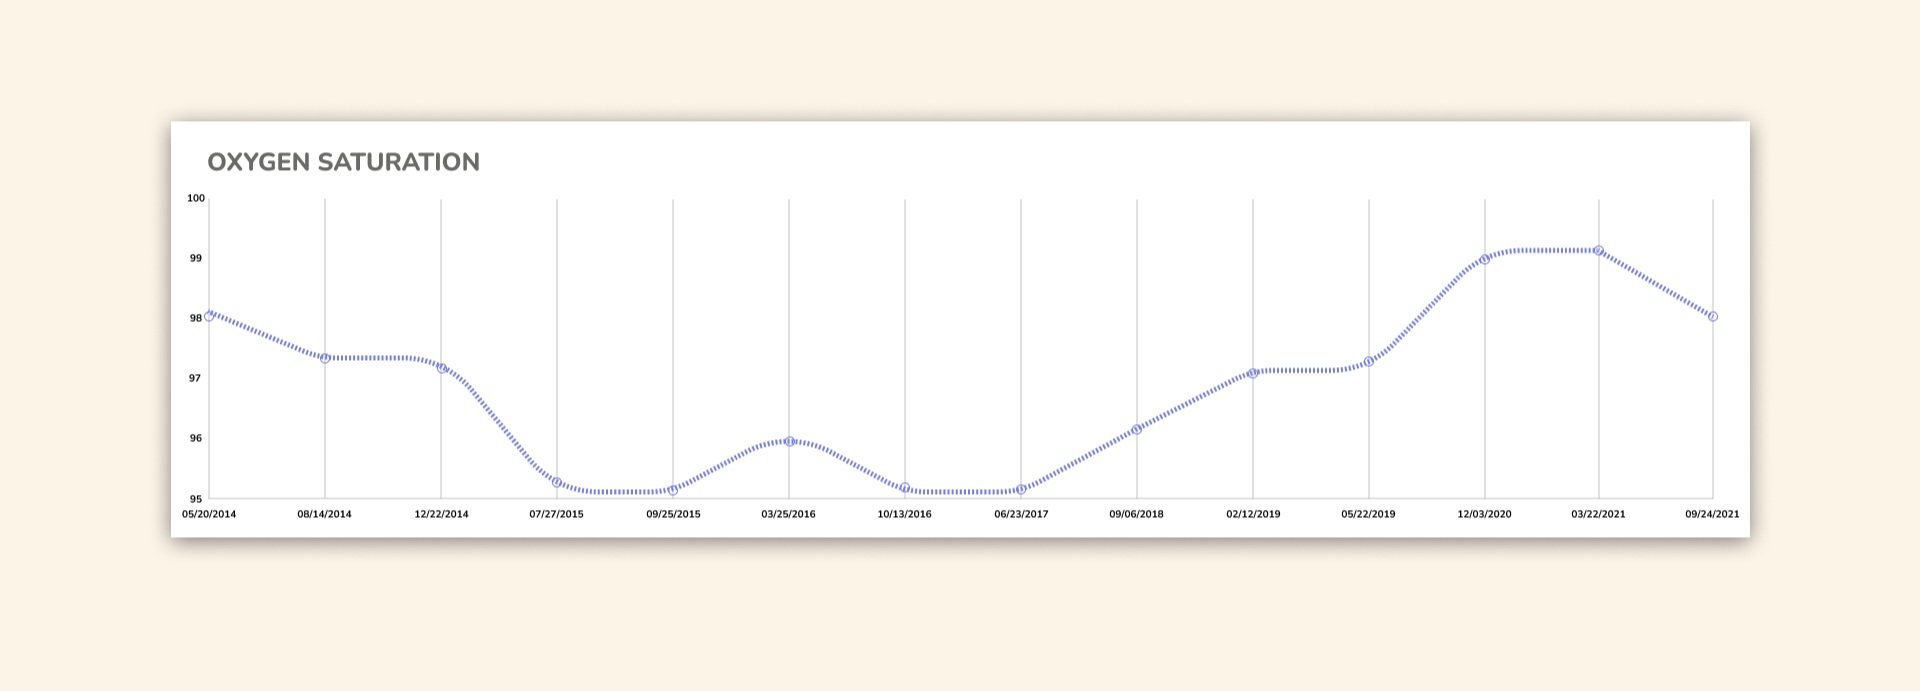
The Oxygen Saturation Chart shows your oxygen saturation over time in a line graph.
Low: <95%
Visual displaying an oxygen (O2) saturation chart over time in Wingspan Health.
Heart & Lung Data Display
The Heart & Lung Data Display shows a historical list of your heart and lung vital signs of heart rate, respiratory rate, and oxygen saturation. Hovering over the measurements will give you some context of what's low, normal, elevated, and high.
Visual displaying a data display of heart rate, breathing rate, and oxygen saturation over time in Wingspan Health.
Temperature
Body temperature is a standard measurement for overall health. A high temperature can indicate infection or immune response. A too-low temperature can indicate hormonal imbalance. Your average non-fever temperature is: 98.3 (F).
Temperature Chart and Data
The Temperature Chart shows your temperature over time in a line graph.
The Temperature Data Display shows a historical list of body temperature.
Hovering over the measurements for temperature will give you some context of what's low, normal, or that you had a fever.
Low: <95.0
Normal: 95-100.4
Fever: >100.4
Visual displaying a chart and table of recorded body temperatures over time in Wingspan Health.
All Vital Signs
The All Vital Signs data display gives you a list of all of the recorded values for each of the aforementioned vital signs from all of your visits to your healthcare provider.
All Vital Signs Data Display
The data display is broken down by when it was measured (Date), what was measured (Measurement), how much it was (Value), and where it took place (Organization).
Visual displaying a record of all vital signs (body size, blood pressure, heart & lung, temperature) in Wingspan Health.
About Wingspan Health
Wingspan Health is a healthcare technology company that believes that quality healthcare should be accessible for everyone.
Our tool helps you understand your health by organizing your medical information in one place – from all of your patient portal accounts at each of your healthcare providers.
You May Also Like
Explore these other posts to learn more about healthcare, medical information, and Wingspan Health.


